| Variable | Coefficient |
95% confidence interval
|
|
|---|---|---|---|
| conf.low | conf.high | ||
| (Intercept) | 7753.000 | 7389.0 | 8117.0 |
| AirlineAir India | 1846.000 | 1473.0 | 2218.0 |
| AirlineGoAir | -37.000 | -577.0 | 503.0 |
| AirlineIndiGo | 267.000 | -89.0 | 624.0 |
| AirlineJet Airways | 4158.000 | 3806.0 | 4511.0 |
| AirlineMultiple carriers | 3050.000 | 2668.0 | 3433.0 |
| AirlineMultiple carriers Premium economy | 3661.000 | 1983.0 | 5339.0 |
| AirlineSpiceJet | -208.000 | -601.0 | 184.0 |
| AirlineTrujet | -3615.000 | -9549.0 | 2319.0 |
| AirlineVistara | 2197.000 | 1766.0 | 2627.0 |
| AirlineVistara Premium economy | 5124.000 | 1688.0 | 8561.0 |
| Total_Stops2 stops | 2002.000 | 1805.0 | 2200.0 |
| Total_Stops3 stops | 3286.000 | 2383.0 | 4190.0 |
| Total_Stops4 stops | 8073.000 | 2145.0 | 14001.0 |
| Total_Stopsnon-stop | -3917.000 | -4100.0 | -3733.0 |
| duration_total_hr | 0.495 | -10.4 | 11.4 |
Model
Table
Linear Regession Model Equation
\[ \begin{aligned} \hat{Y} =\ & 7753 \\ & + 1846 \cdot \text{Airline}_{\text{Air India}} \\ & -\ 37 \cdot \text{Airline}_{\text{GoAir}} \\ & + 267 \cdot \text{Airline}_{\text{IndiGo}} \\ & + 4158 \cdot \text{Airline}_{\text{Jet Airways}} \\ & + 3050 \cdot \text{Airline}_{\text{Multiple carriers}} \\ & + 3661 \cdot \text{Airline}_{\text{Multiple carriers Premium economy}} \\ & -\ 208 \cdot \text{Airline}_{\text{SpiceJet}} \\ & -\ 3615 \cdot \text{Airline}_{\text{Trujet}} \\ & + 2197 \cdot \text{Airline}_{\text{Vistara}} \\ & + 5124 \cdot \text{Airline}_{\text{Vistara Premium economy}} \\ & + 2002 \cdot \text{Stops}_{\text{2 stops}} \\ & + 3286 \cdot \text{Stops}_{\text{3 stops}} \\ & + 8073 \cdot \text{Stops}_{\text{4 stops}} \\ & -\ 3917 \cdot \text{Stops}_{\text{non-stop}} \\ & + 0.495 \cdot \text{duration\_total\_hr} \end{aligned} \]
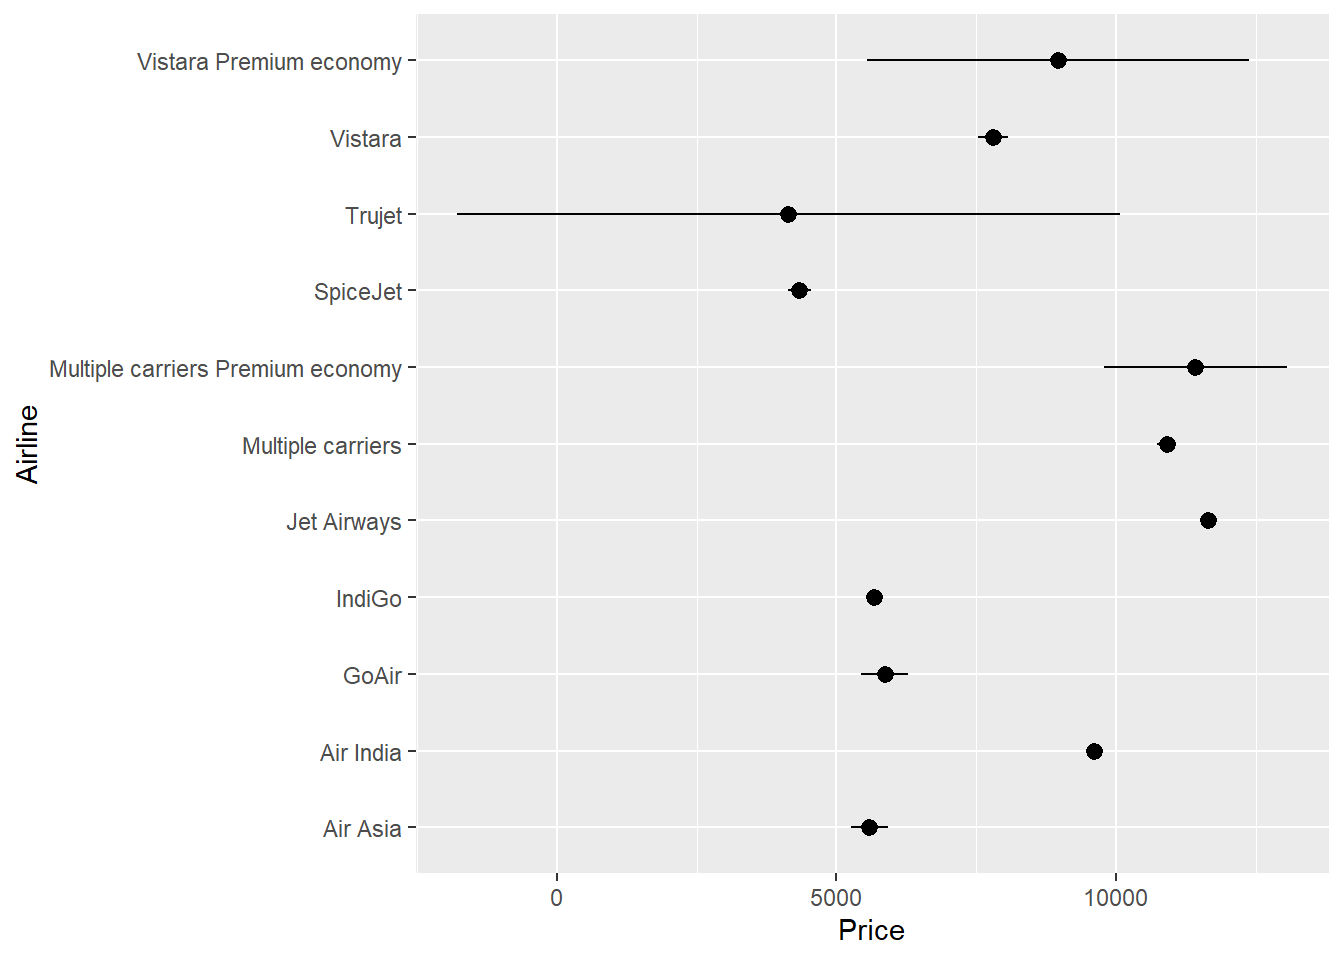
The plot illustrates the predicted ticket prices across different airlines based on a linear regression model that incorporates Airline, Total Stops, and Total Duration (hours) as predictors. Each line represents a specific airline, showing how price varies across the observed range of values. Airlines such as Jet Airways, Air India, and Multiple Carriers display wider price ranges and more variability, while budget airlines like GoAir and SpiceJet show tighter, more consistent pricing patterns. The dense overlap of lines in the lower price range (below 20,000) suggests that many airlines operate within similar pricing bands, though premium carriers and classes (e.g., Vistara Premium Economy) occupy higher price segments. This model-based visualization helps identify airline-specific pricing trends and supports comparison across carrier types.